Glucose Metrics 101
Feb 7, 2025
Uvika Chaturvedi
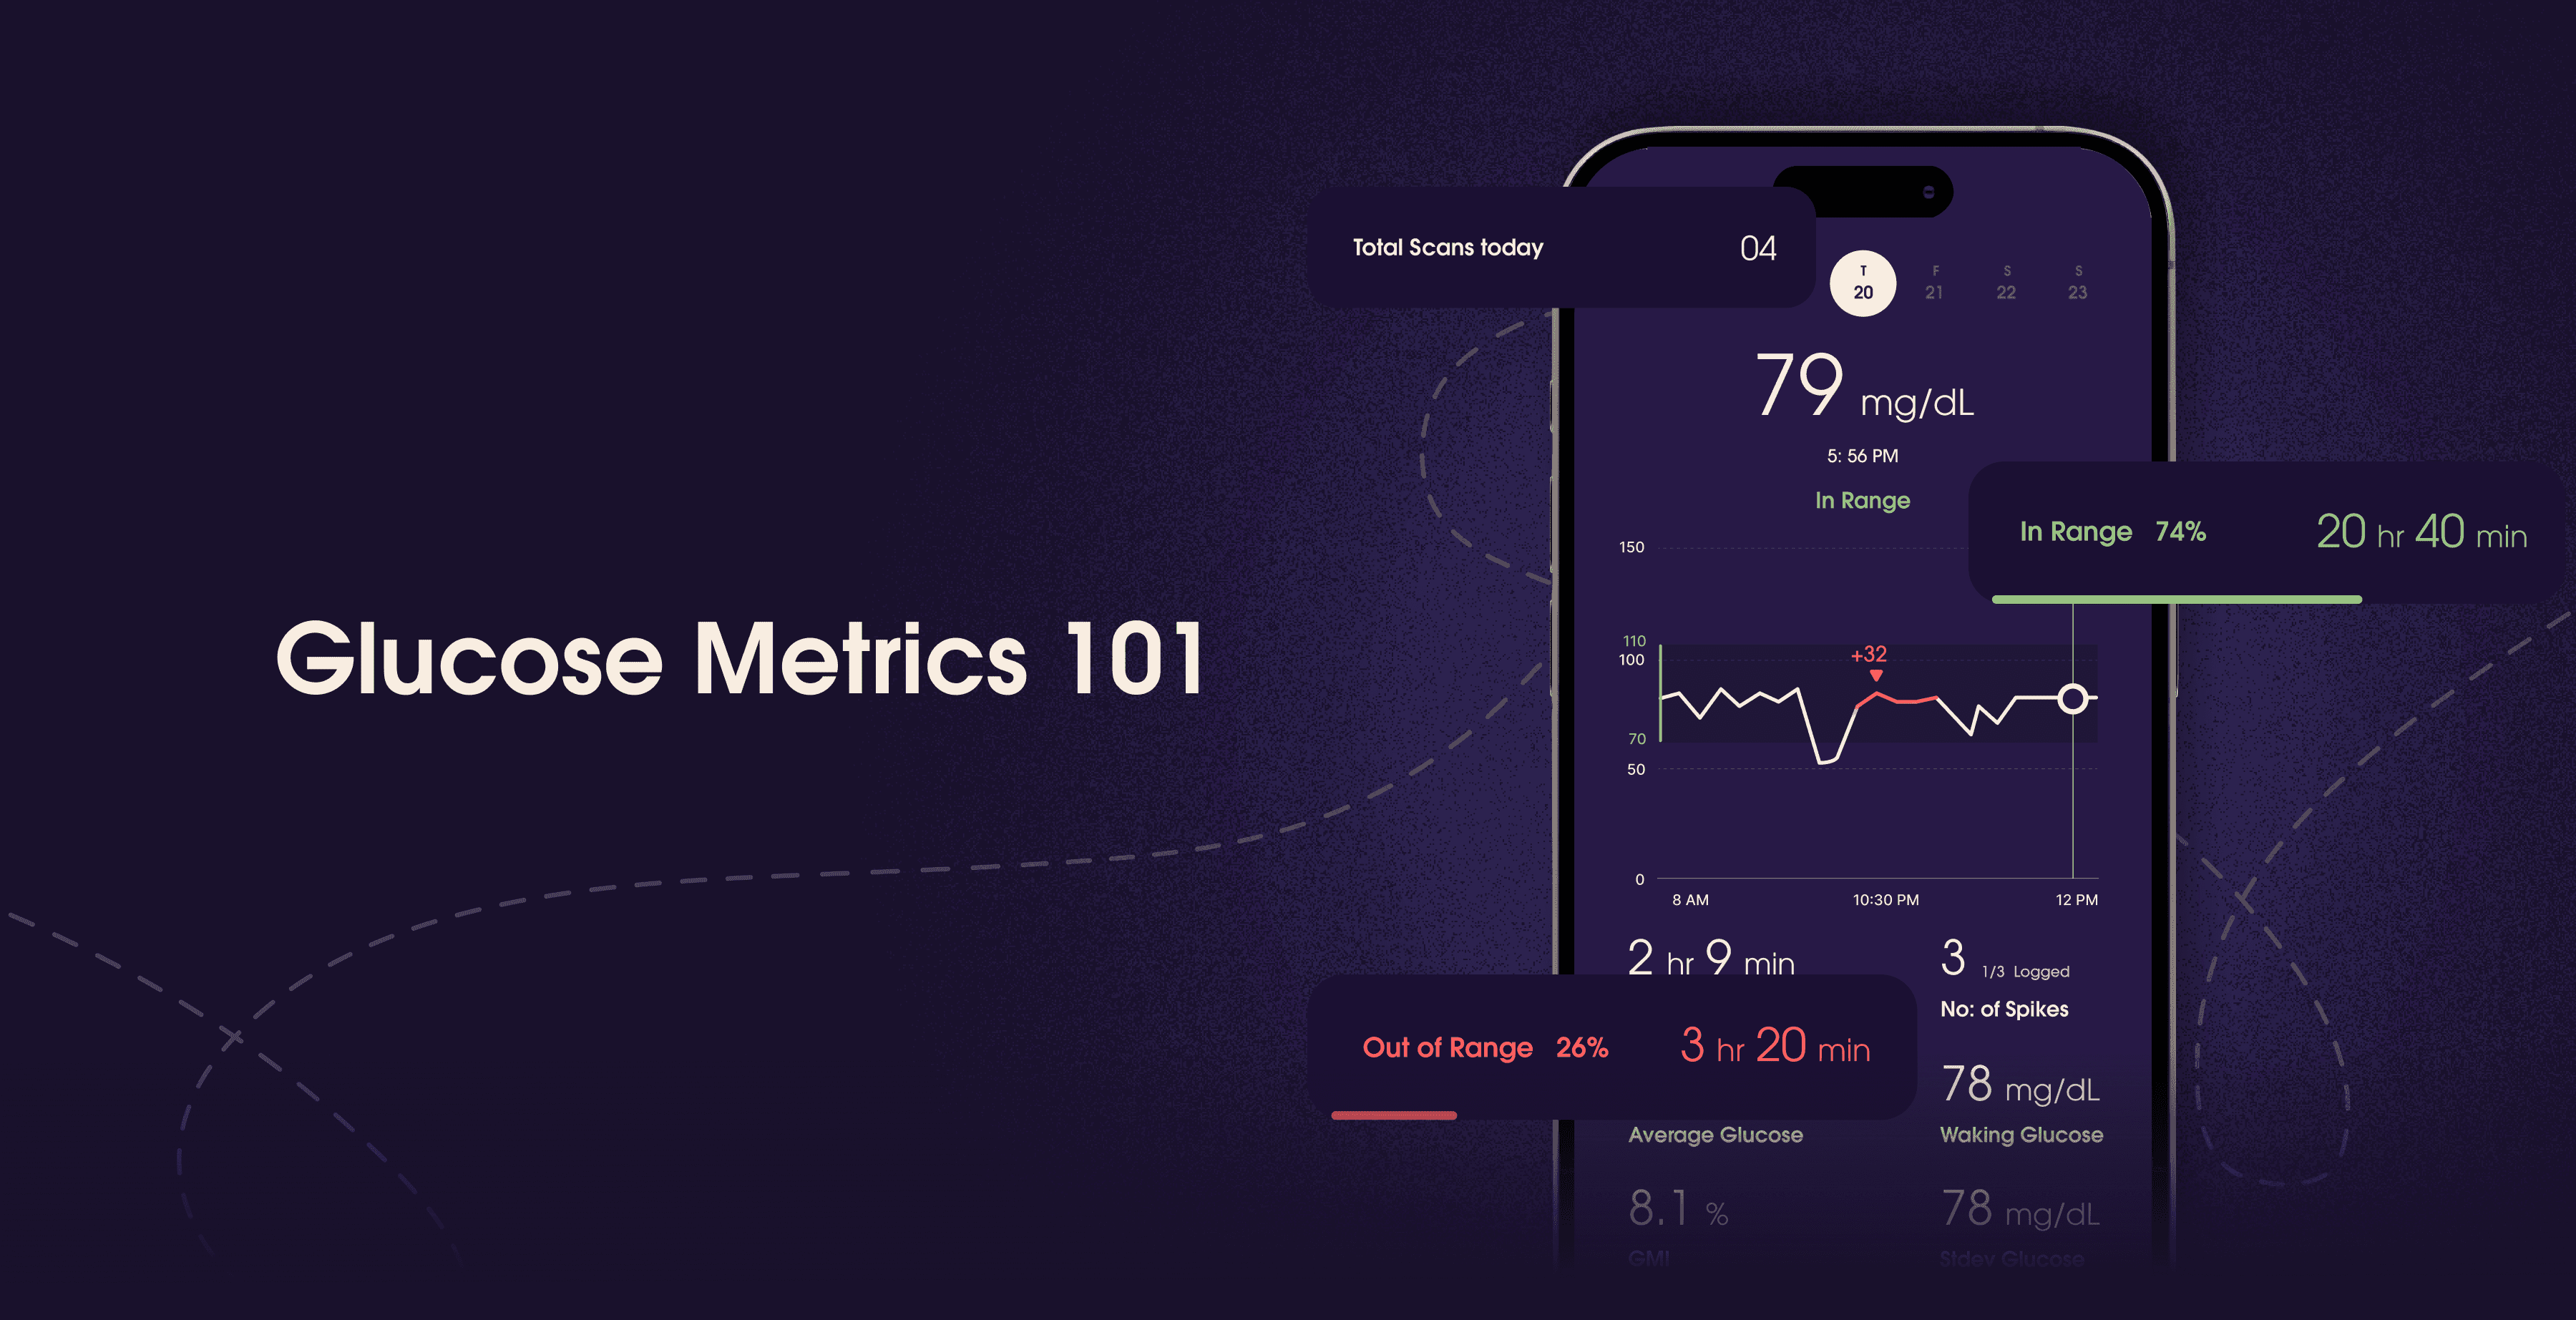


Table Of Contents
So let's talk about glucose numbers, shall we?
Now that continuous glucose monitors (CGMs) are becoming popular and is expected to increase, especially due to the availability of CGMs over the counter, the wearable/biosensor industry is making more and more meaningful metrics available for the users of CGM to make them understand the different patterns and nuances of their glucose data.
Highlights
What is CGM? Continuous Glucose Monitors (CGMs) measure glucose levels in interstitial fluid, providing real-time trends instead of single data points like traditional blood glucose meters.
Blood Glucose vs CGM: Blood glucose meters are more accurate for single readings, but CGMs offer a broader picture of glucose trends over time.
Key Glucose Metrics: Time in Range (TIR): The percentage of time glucose levels stay within a target range (70-180 mg/dL).
Glucose Spikes: Post-meal spikes exceeding +30mg/dL can indicate poor glycemic control.
Fasting vs Waking Glucose: Fasting glucose is measured after an overnight fast, while waking glucose estimates fasting levels using CGM data.
GMI vs HbA1c: Glucose Management Index (GMI) uses CGM data to estimate HbA1c, offering a more dynamic view of glucose trends.
Why Use CGM? CGMs reduce the need for frequent finger pricks and provide actionable insights for personalized diabetes management.
Blood Glucose vs Continuous Glucose
Since this is a 101 lecture, it is very important to understand the nuance between blood glucose meters (BGM) and continuous glucose monitors. The continuous glucose reading are taken from the interstitial fluid – a thin layer of fluid surrounding the cells of the tissues below the skin. This would be different from blood glucose meter reading since it comes by pricking your finger and measuring the glucose from blood directly.
You must be thinking if cgm data is accurate. Well the blood glucose meter data may not match the CGM data. Glucose first enters the bloodstream and then would be absorbed by the interstitial fluid. So there could be a lag between the continuous glucose reading and blood glucose reading. The bottom line is that fingerstick testing still gives the most accurate results of your glucose
So why use CGM? Blood glucose meters give reading as a one data point in time whereas CGMs will give a bigger picture of your glucose trends. This would result in more precise and personalized actions that you could take at a point in time. Also pricking your finger multiple times a day is not fun whereas CGM is attached to your arm or belly like a sticker for 10 or 15 days depending on the model you use.
ABCs of the CGM Metrics
There are so many metrics related to glucose out there but it is important to understand the difference between them and know when to use which metric.

Average, Stdev Glucose
Starting with the easiest first. These are as simple as calculating the average and the standard deviation of your glucose data.
So how to use these metrics? Average glucose is highly correlated with A1c value and some doctors and researchers give a benchmark for average glucose and standard deviation to maintain. While this metric could give high level targets for people to maintain, the time in range metric, which we will talk about next, is more popular.
Time in Range
Time in Range is the time spent within a targeted range in a particular time frame. Most of the apps with this metric give you the option to choose the range of the timeframe. American Diabetes Association (ADA) recommends that the target range should be 70 to 180 mg/dL for most people. More research needs to be conducted to understand how often this metric should be measured but a lot of people with diabetes find daily and weekly summaries helpful.
Glucose Spikes and more
This metric is the newbie in the glucose metric dictionary! It is important to understand that there is not a lot of consensus around the term “spike”. But there is a lot of research that high glycemic variability can result in insulin resistance, oxidative stress and inflammation, cognitive dysfunction, and increased mortality risk. Hence looking at your number of spikes and spike time could be a great metric to understand your glycemic variability.
We all know glucose varies but how much is too much variability is important to understand. Based on a study, researchers found that the average post-meal glucose spike for healthy adults without diabetes was 99 +/- 10.5 mg/dL after a regular balanced meal. However, meals with significantly more refined sugar and less amount of fiber, caused a higher glucose spike of 133 +/- 14 mg/dL after the meal in the same population. Based on the above confidence interval, it is safe to aim for a postprandial glucose spike, aka spike after meal, of no more than +30mg/dL.
Waking Glucose vs Fasting Glucose
We see fasting glucose metric on our lab reports (hopefully every year during your preventive visits?). Fasting glucose test is a screening test for Type II Diabetes, Prediabetes, and Gestational Diabetes.This metric measures your blood glucose at its lowest point, when you are empty stomach for a while. Waking glucose, on the other hand, attempts to estimate your fasting glucose with your CGM data. It measures the average of your glucose data in the hour before you are up. Fasting glucose is obviously the more accurate one but waking glucose gives you a good direction of your trend of the fasting glucose.
Glucose Monitoring Index (GMI) vs HbA1c
HbA1c is the average blood glucose level over the period of the last three months.Why three months, you ask? Three months is the average lifespan of a red blood cell. Just like fasting glucose, HbA1c is used to diagnose Type II Diabetes, Prediabetes, and Gestational Diabetes. GMI uses the CGM data to give you an idea of your HbA1c trend. GMI and HbA1c are not the same but are a different way of presenting your average glucose average. In the 2010s, the #BeyondA1C movement made GMI as the better indicator out of the two metrics for glucose average. Also, since HbA1c could be highly skewed based on low or high glucose value just before your tests. A team of researchers in 2018, have agreed with the #BeyongA1c movement and found that out of the two metrics, GMI is a better indicator of the glucose trend.
Finding ways to improve your glucose metrics? Here is an article that helps you gives tips on managing glucose spikes.
Reference
https://diabetes.org/about-diabetes/devices-technology/cgm-time-in-range
https://www.freestylelibre.com.au/difference-between-glucose-interstitial-glucose
https://www.diabetesresearchclinicalpractice.com/article/S0168-8227(19)31097-6/abstract
https://www.sciencedirect.com/science/article/abs/pii/S0166432811002129?via%3Dihub
https://my.clevelandclinic.org/health/diagnostics/21952-fasting-blood-sugar
https://www.webmd.com/diabetes/glycated-hemoglobin-test-hba1c
https://www.healthline.com/health/diabetes/what-is-gmi#gmi-vs-a-1-c
So let's talk about glucose numbers, shall we?
Now that continuous glucose monitors (CGMs) are becoming popular and is expected to increase, especially due to the availability of CGMs over the counter, the wearable/biosensor industry is making more and more meaningful metrics available for the users of CGM to make them understand the different patterns and nuances of their glucose data.
Highlights
What is CGM? Continuous Glucose Monitors (CGMs) measure glucose levels in interstitial fluid, providing real-time trends instead of single data points like traditional blood glucose meters.
Blood Glucose vs CGM: Blood glucose meters are more accurate for single readings, but CGMs offer a broader picture of glucose trends over time.
Key Glucose Metrics: Time in Range (TIR): The percentage of time glucose levels stay within a target range (70-180 mg/dL).
Glucose Spikes: Post-meal spikes exceeding +30mg/dL can indicate poor glycemic control.
Fasting vs Waking Glucose: Fasting glucose is measured after an overnight fast, while waking glucose estimates fasting levels using CGM data.
GMI vs HbA1c: Glucose Management Index (GMI) uses CGM data to estimate HbA1c, offering a more dynamic view of glucose trends.
Why Use CGM? CGMs reduce the need for frequent finger pricks and provide actionable insights for personalized diabetes management.
Blood Glucose vs Continuous Glucose
Since this is a 101 lecture, it is very important to understand the nuance between blood glucose meters (BGM) and continuous glucose monitors. The continuous glucose reading are taken from the interstitial fluid – a thin layer of fluid surrounding the cells of the tissues below the skin. This would be different from blood glucose meter reading since it comes by pricking your finger and measuring the glucose from blood directly.
You must be thinking if cgm data is accurate. Well the blood glucose meter data may not match the CGM data. Glucose first enters the bloodstream and then would be absorbed by the interstitial fluid. So there could be a lag between the continuous glucose reading and blood glucose reading. The bottom line is that fingerstick testing still gives the most accurate results of your glucose
So why use CGM? Blood glucose meters give reading as a one data point in time whereas CGMs will give a bigger picture of your glucose trends. This would result in more precise and personalized actions that you could take at a point in time. Also pricking your finger multiple times a day is not fun whereas CGM is attached to your arm or belly like a sticker for 10 or 15 days depending on the model you use.
ABCs of the CGM Metrics
There are so many metrics related to glucose out there but it is important to understand the difference between them and know when to use which metric.

Average, Stdev Glucose
Starting with the easiest first. These are as simple as calculating the average and the standard deviation of your glucose data.
So how to use these metrics? Average glucose is highly correlated with A1c value and some doctors and researchers give a benchmark for average glucose and standard deviation to maintain. While this metric could give high level targets for people to maintain, the time in range metric, which we will talk about next, is more popular.
Time in Range
Time in Range is the time spent within a targeted range in a particular time frame. Most of the apps with this metric give you the option to choose the range of the timeframe. American Diabetes Association (ADA) recommends that the target range should be 70 to 180 mg/dL for most people. More research needs to be conducted to understand how often this metric should be measured but a lot of people with diabetes find daily and weekly summaries helpful.
Glucose Spikes and more
This metric is the newbie in the glucose metric dictionary! It is important to understand that there is not a lot of consensus around the term “spike”. But there is a lot of research that high glycemic variability can result in insulin resistance, oxidative stress and inflammation, cognitive dysfunction, and increased mortality risk. Hence looking at your number of spikes and spike time could be a great metric to understand your glycemic variability.
We all know glucose varies but how much is too much variability is important to understand. Based on a study, researchers found that the average post-meal glucose spike for healthy adults without diabetes was 99 +/- 10.5 mg/dL after a regular balanced meal. However, meals with significantly more refined sugar and less amount of fiber, caused a higher glucose spike of 133 +/- 14 mg/dL after the meal in the same population. Based on the above confidence interval, it is safe to aim for a postprandial glucose spike, aka spike after meal, of no more than +30mg/dL.
Waking Glucose vs Fasting Glucose
We see fasting glucose metric on our lab reports (hopefully every year during your preventive visits?). Fasting glucose test is a screening test for Type II Diabetes, Prediabetes, and Gestational Diabetes.This metric measures your blood glucose at its lowest point, when you are empty stomach for a while. Waking glucose, on the other hand, attempts to estimate your fasting glucose with your CGM data. It measures the average of your glucose data in the hour before you are up. Fasting glucose is obviously the more accurate one but waking glucose gives you a good direction of your trend of the fasting glucose.
Glucose Monitoring Index (GMI) vs HbA1c
HbA1c is the average blood glucose level over the period of the last three months.Why three months, you ask? Three months is the average lifespan of a red blood cell. Just like fasting glucose, HbA1c is used to diagnose Type II Diabetes, Prediabetes, and Gestational Diabetes. GMI uses the CGM data to give you an idea of your HbA1c trend. GMI and HbA1c are not the same but are a different way of presenting your average glucose average. In the 2010s, the #BeyondA1C movement made GMI as the better indicator out of the two metrics for glucose average. Also, since HbA1c could be highly skewed based on low or high glucose value just before your tests. A team of researchers in 2018, have agreed with the #BeyongA1c movement and found that out of the two metrics, GMI is a better indicator of the glucose trend.
Finding ways to improve your glucose metrics? Here is an article that helps you gives tips on managing glucose spikes.
Reference
https://diabetes.org/about-diabetes/devices-technology/cgm-time-in-range
https://www.freestylelibre.com.au/difference-between-glucose-interstitial-glucose
https://www.diabetesresearchclinicalpractice.com/article/S0168-8227(19)31097-6/abstract
https://www.sciencedirect.com/science/article/abs/pii/S0166432811002129?via%3Dihub
https://my.clevelandclinic.org/health/diagnostics/21952-fasting-blood-sugar
https://www.webmd.com/diabetes/glycated-hemoglobin-test-hba1c
https://www.healthline.com/health/diabetes/what-is-gmi#gmi-vs-a-1-c
Table Of Contents
Table Of Contents
Table Of Contents
Read More

Mar 25, 2025
Sayfali Rawlani

Mar 20, 2025
Sayfali Rawlani

Mar 6, 2025
Sayfali Rawlani


Copyright © 2025 trst health. All right reserved.

